Advanced reporting
The advanced reporting section allows you to analyze and visualize your survey data using a data table format. The data table includes aggregated data from your contacts (respondents) and survey results (score, feedback, extra responses, sent date, …)
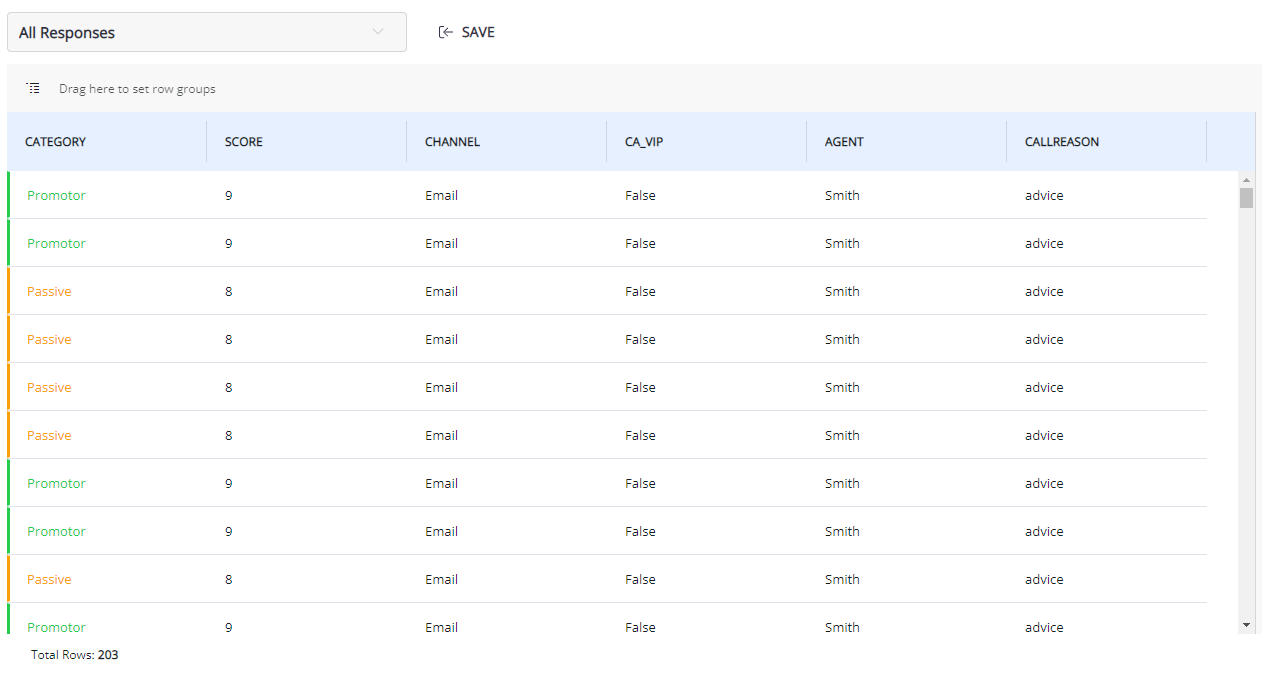
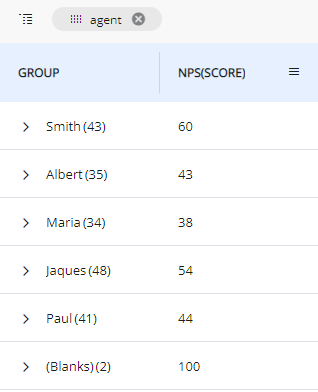
This allows you to view and analyze your survey results in a more detailed and customized way. You can filter and group the data to gain insights into specific aspects of your survey, such as demographic data or specific survey responses.
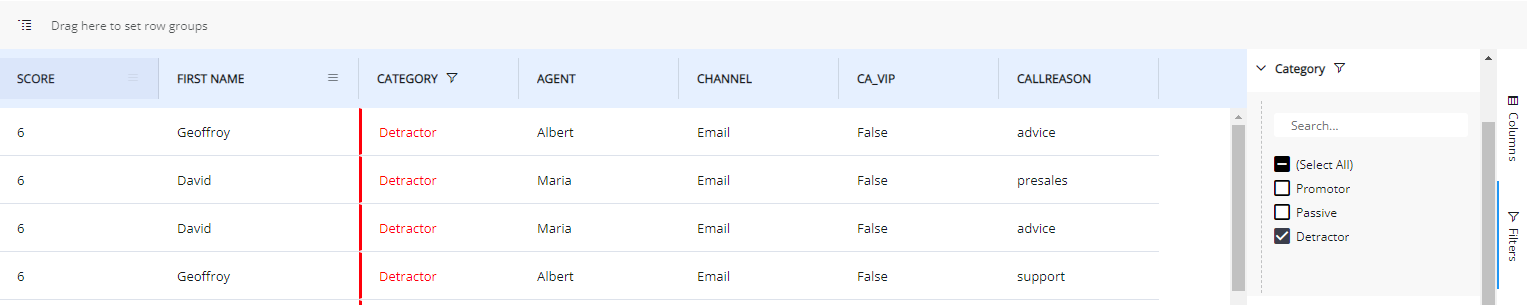
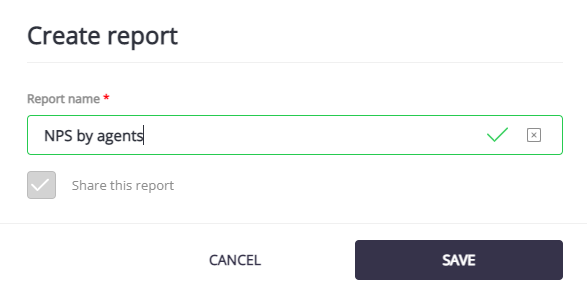
You can customize the data table to show only the information you need, and create custom reports to save and share with your team:
Additionally, the grid supports exporting data to various formats, including CSV and Excel, for further analysis outside of the platform.
Please note this advanced reporting is only available in the Growth and Business plan. More information about our plans can be found here.
Updated 13 days ago