Survey dashboard
After you've sent out your survey and received responses, it's important to analyze the datato gain insights and make informed decisions. Naxai offers several reporting options to help you visualize and interpret your survey results.
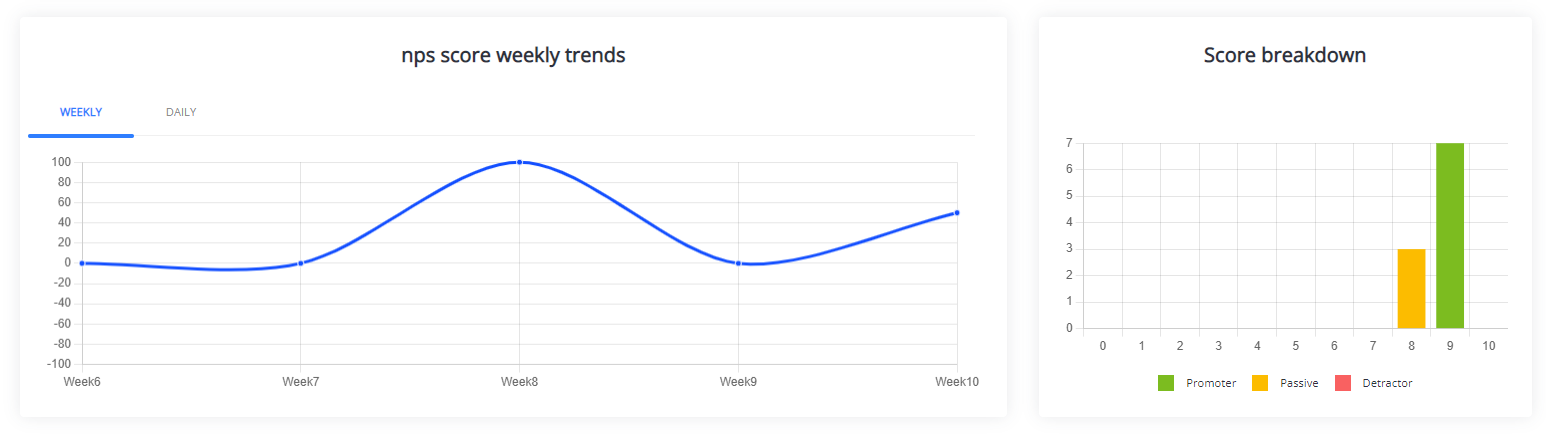
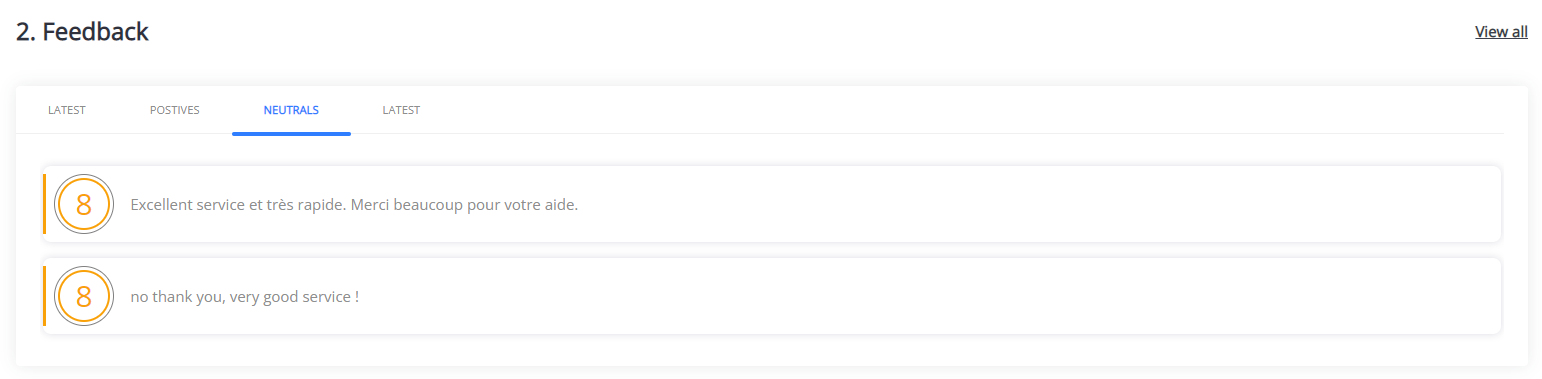
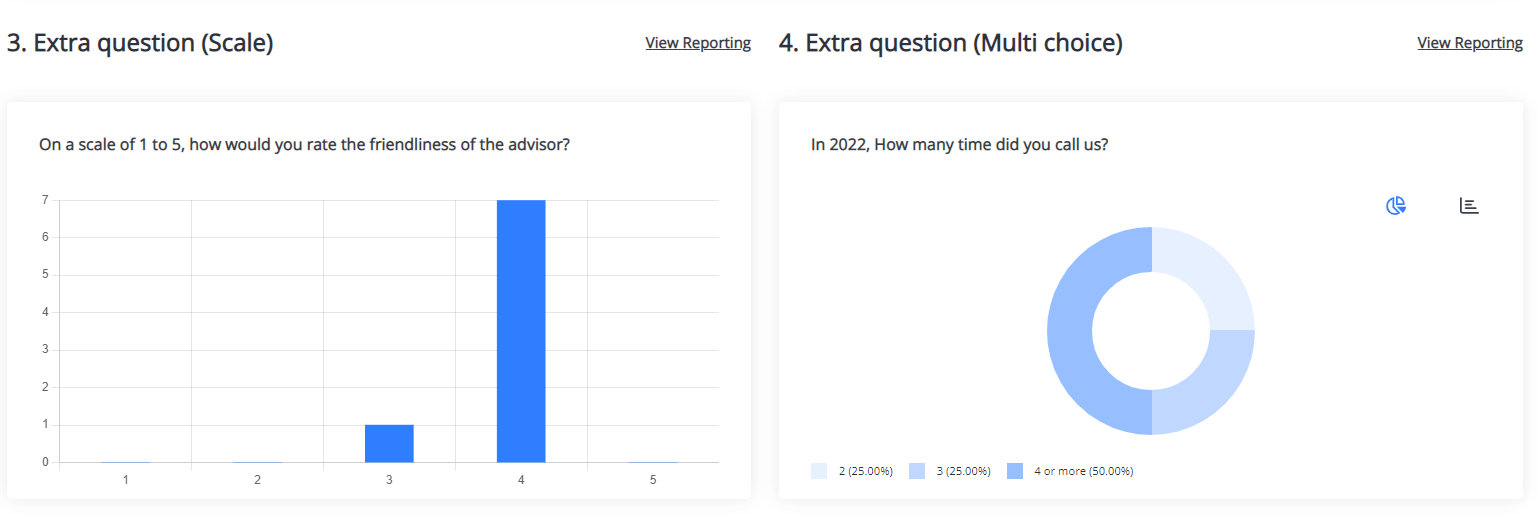
The dashboard is the main page of the survey reporting section, providing an overview of your survey's performance. The dashboard displays key metrics, such as scores, completed rates, trends and latest feedback in an easily digestible format.
You can view data for up to 12 months using a datetime picker to select any specific date range.
The dashboard is designed to give you a quick snapshot of your survey's performance, so you can make informed decisions and take appropriate action to improve your results.
Check out this video to guide you through the analysis of your surveys.
Updated about 1 month ago